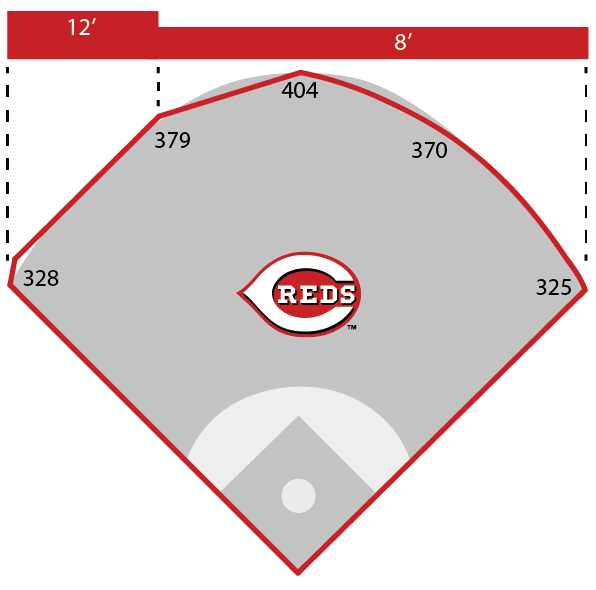
Located up against the north bank of the Ohio River, Great American Ball Park's tight dimensions have long made it one of the most home-run-friendly venues in Major League Baseball.
Unlike many hitters parks, there isn't one singular hotspot in the outfield where Cincinnati stands out as dramatically shorter than average. Although the 12-foot fence in left makes that side slightly less inviting, the entire outfield is capable of yielding cheap home runs. If targeting one area, right-center field remains particularly favorable relative to league norms.
In 2025, something unusual happened. Even for a park known for home runs, the results dipped enough for the model to take notice. It usually takes more than a short hot or cold streak to move a park�s baseline, but that season�s home run totals ran below what we would normally expect after accounting for contact quality, weather, the park itself, and even the characteristics of the baseball. What made it interesting is that fly ball distance at GABP didn't really drop compared to other parks. That suggests the ball may have been behaving differently on certain types of fly balls rather than the stadium suddenly playing bigger. It�s also possible it was simply short-term noise that would have corrected over time. Either way, it was a reminder that even the league�s most homer-friendly park can fluctuate from year to year. Over the long haul, though, Great American still clearly leans toward hitters when it comes to home runs, especially when the weather cooperates.
Partially offsetting the home run boost is a below-average rating in batter contact. According to the Ballpark Pal model, hitters are about 1.1% less likely to put the ball in play after controlling for player skill. This may reflect an aggressive, power-oriented approach that the dimensions invite, or it could stem from aesthetic elements such as the batter's eye.
The home run favorability at Great American Ball Park is driven primarily by its dimensions rather than environmental volatility. Wind speed averages 6 mph and the venue ranks 21st in wind receptiveness, placing it in the lower half of MLB in terms of wind influence. The stadium sits 683 feet above sea level and carry distance grades slightly above average overall.
Overall, GABP ranks 17th for day-to-day variation, which places it in the bottom half for fully outdoor stadiums and reinforces how stable its run environment tends to be compared to more weather-sensitive parks.